Resources

Platform Guides

Deep operational guides for every module in IOTrope — from shop floor hierarchy design to order management, device connectivity, and access control.

16 guides

Shop Floor Management

Shop Floor Groups: Structuring Your Production Hierarchy

The SFG list is your top-level control panel for every production group in the factory. Each row is a Shop Floor Group — a named node in your hierarchy (like EDM L1 M2 or Grind L2 M3) with a unique code in brackets. The view supports filtering by All SFG, SFG Without Devices, and SFG With Devices, and can be toggled between a flat list and a parent-child tree. Every group has edit, delete, and expand actions. The breadcrumb filter at the top lets you drill from unit level down to a specific machine.

  • What Shop Floor Groups are and why hierarchy design matters
  • Creating the Unit → Department → Line → Machine structure
  • Using parent-child relationships to organize multi-department factories
  • Filtering SFGs: All, With Devices, Without Devices
  • Expanding and collapsing the hierarchy tree for navigation
  • SFG codes (EDML1M2, GL1M1) — naming conventions and best practices
DevicesShiftsUsersJobsSFG Hierarchy Canvas

For: Plant managers and operations leads designing their first structured shopfloor hierarchy, or restructuring an existing one.
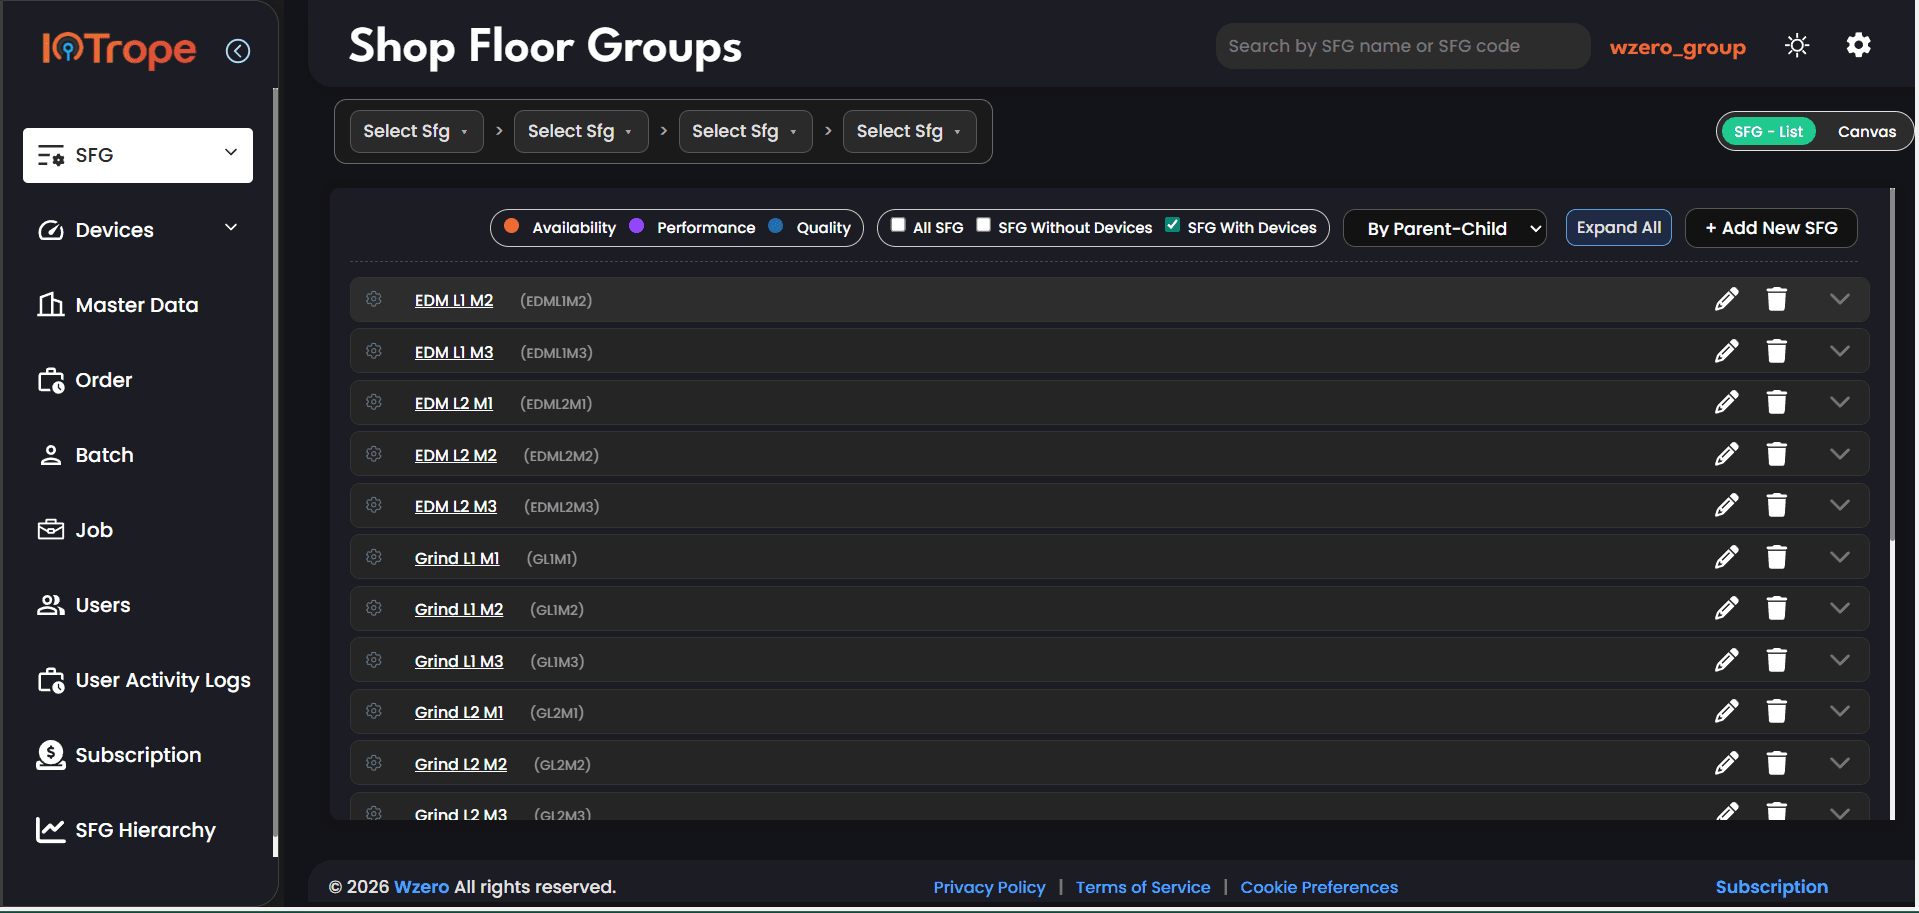
Shop Floor Groups list showing EDM and Grind machine groups organized by parent-child hierarchyShop Floor Groups list showing EDM and Grind machine groups organized by parent-child hierarchy
Click to expand
Shop Floor Management

Machine Live Data: Connecting Devices to Shop Floor Groups

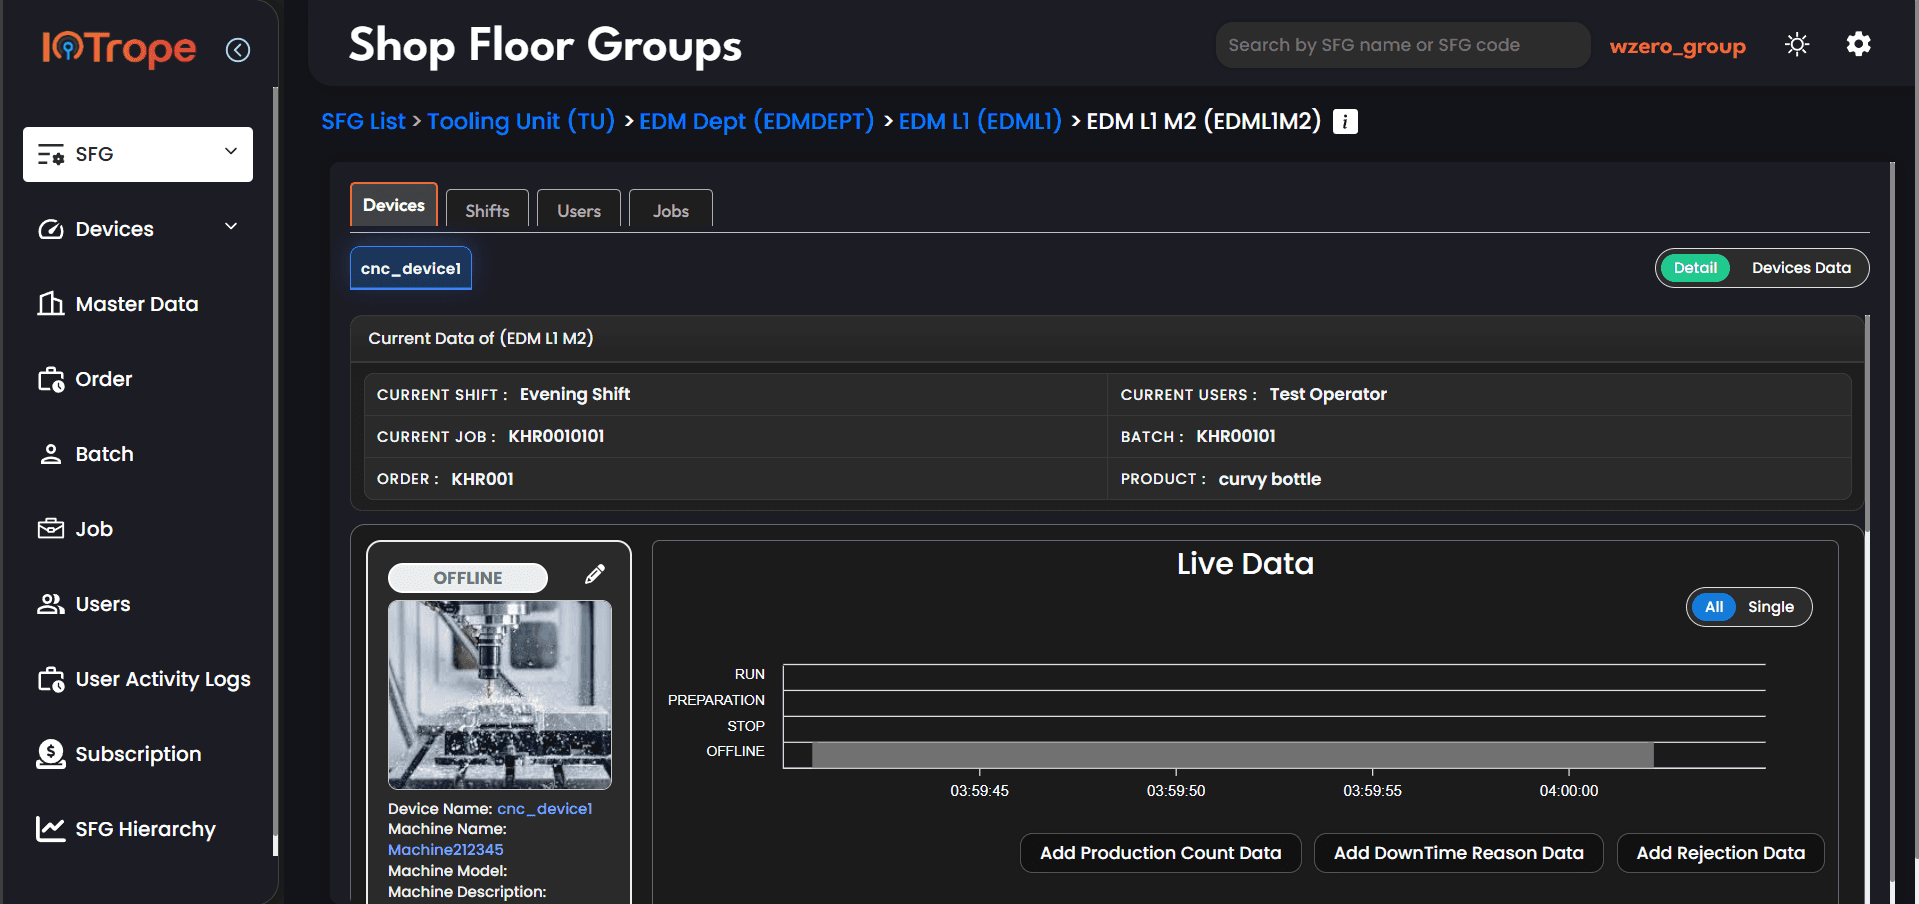
This is the Device tab inside an SFG (here: EDM L1 M2). It shows the currently assigned device (cnc_device1), the machine's live status badge (OFFLINE), and a real-time timeline chart with four state bands: RUN, PREPARATION, STOP, and OFFLINE. Above the chart, current context is always visible: Current Shift (Evening Shift), Current User (Test Operator), Current Job (KHR0010101), Batch (KHR00101), Order (KHR001), and Product (curvy bottle). At the bottom are three action buttons: Add Production Count Data, Add DownTime Reason Data, and Add Rejection Data.

  • Four machine states: RUN, PREPARATION, STOP, OFFLINE — what each means
  • How a device (CNC Device / Node) is assigned to an SFG
  • Reading the live timeline: x-axis is time, y-axis is machine state
  • Current context panel: shift, user, job, batch, order, product
  • Adding Production Count Data — logging parts produced
  • Adding DownTime Reason Data — categorizing stoppages
  • Adding Rejection Data — recording quality issues with rejection type
Devices (CNC Device, Node, Energy Meter)ShiftsJobsBatchOrderMaster Data (DownTime Reason, Rejection Type)

For: Operators, shift supervisors, and OT engineers responsible for real-time machine monitoring and data capture on the shopfloor.

SFG device detail showing a CNC machine in OFFLINE state with live data timeline and current shift, job, batch, and order contextSFG device detail showing a CNC machine in OFFLINE state with live data timeline and current shift, job, batch, and order context
Click to expand
Shop Floor Management

Shift Management: Assigning and Tracking Shifts Inside SFGs

The Shifts tab inside an SFG lists every shift assigned to that machine group. Each row shows the shift name, a unique shift code (ES01, MS01, NS01), start and end times, a 'View List' link to see which users are on that shift, total hours (8:00 for all three here), and an Active status. Shifts are fully editable and deletable per SFG, and a search bar lets you filter by shift name. The '+ Add Shift' button creates a new shift for this SFG specifically.

  • Creating shifts per SFG: name, code, start time, end time
  • Three standard shifts: Morning (06:00–14:00), Evening (14:00–22:00), Night (22:00–06:00)
  • Assigning users to specific shifts via 'View List'
  • How 'Current Shift' is determined on the live device panel
  • Shift status: Active vs Inactive and its effect on reporting
  • Shift data as context in production count, downtime, and OEE calculations
SFG Devices tabUsersMaster Data — ShiftsJobs

For: Production planners, shift supervisors, and operations managers configuring shift-based production tracking.

SFG Shifts tab showing Evening Shift, Morning Shift, and Night Shift with start time, end time, user lists, total hours, and active statusSFG Shifts tab showing Evening Shift, Morning Shift, and Night Shift with start time, end time, user lists, total hours, and active status
Click to expand
User & Access Control

Role-Based Access: Managing Users Within a Shop Floor Group

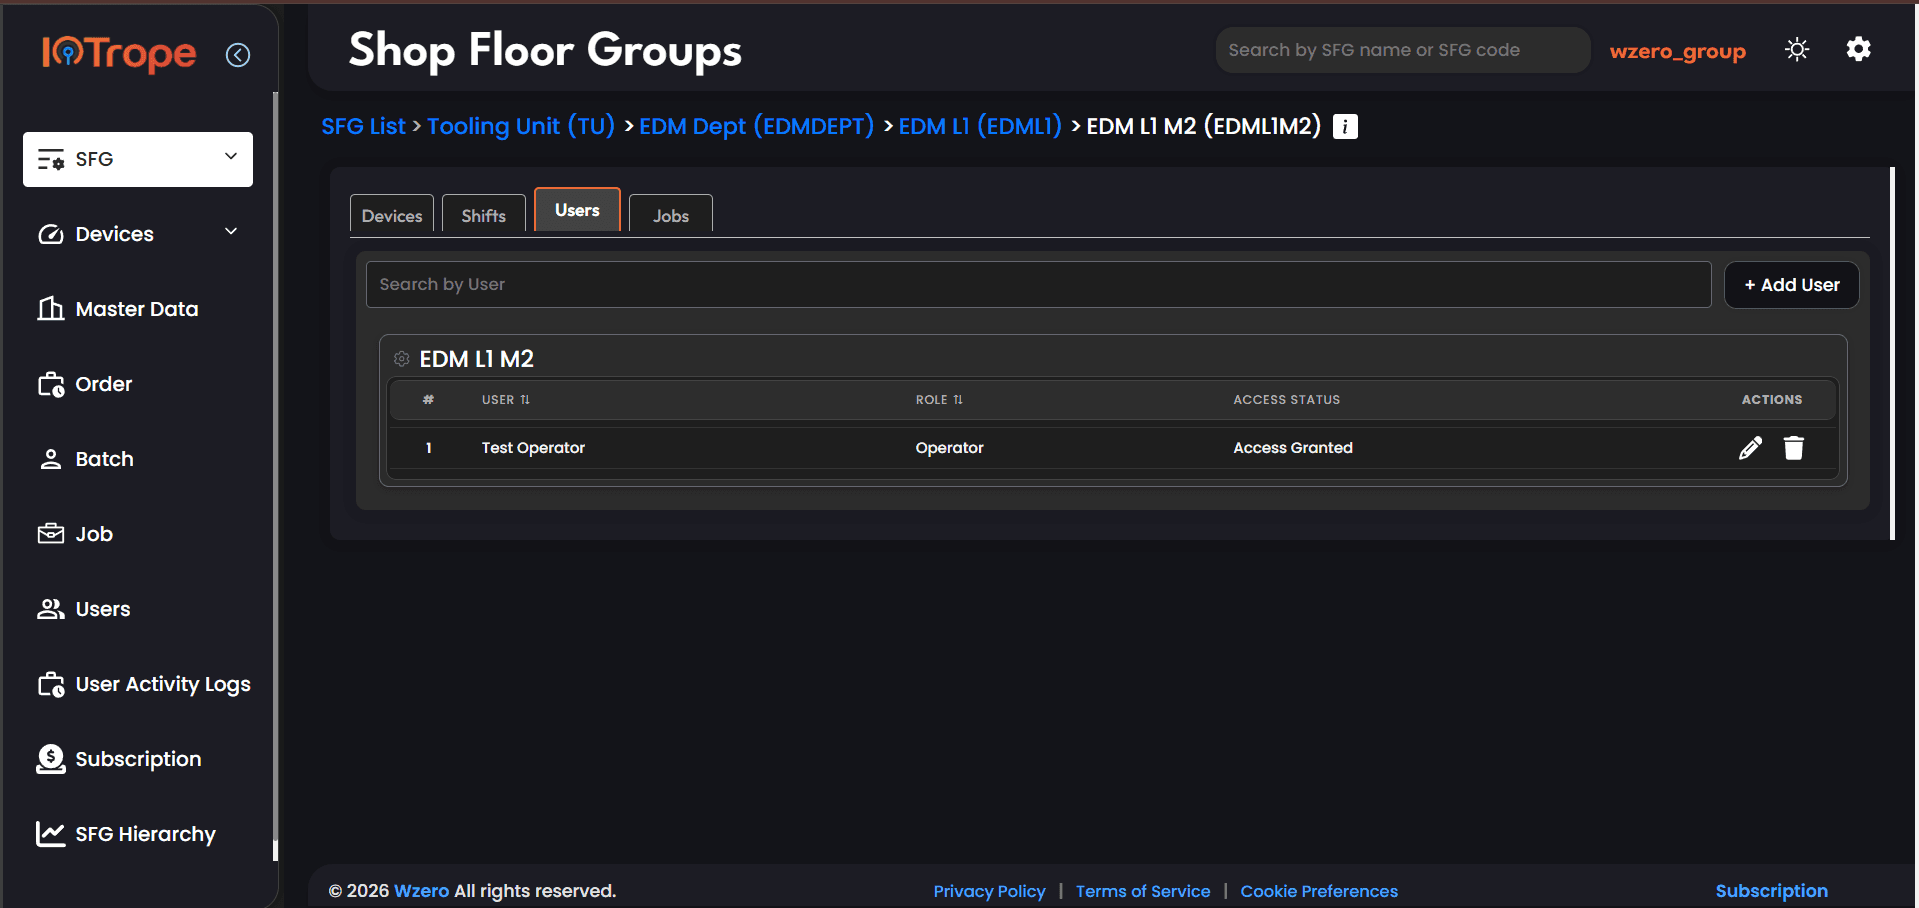
The Users tab inside an SFG shows every user who has been granted access to this specific machine group. The table shows the user name, their role (Operator in this case), and their access status (Access Granted). Editing allows you to change role or revoke access. The '+ Add User' button opens a user picker, and the search bar filters by name. This is SFG-level access — a user can be an Operator on one SFG and a Supervisor on another.

  • SFG-scoped access: why users are assigned per machine group, not globally
  • Three roles: Operator, Manager, Supervisor — what each can do
  • Access status: Granted vs Revoked and its effect on live context
  • How Current User on the live device panel is resolved from SFG users
  • Adding, editing, and removing users from an SFG
  • Relationship between SFG-level users and the global Users module
Users (global)SFG Devices tab (Current Users)SFG Shifts tab (shift-user assignment)User Activity Logs

For: Operations managers, supervisors, and IT-OT leads responsible for access governance across shopfloor machine groups.

SFG Users tab showing Test Operator assigned to EDM L1 M2 with Operator role and Access Granted statusSFG Users tab showing Test Operator assigned to EDM L1 M2 with Operator role and Access Granted status
Click to expand
Shop Floor Management

Job Assignment: Linking Production Jobs to Shop Floor Groups

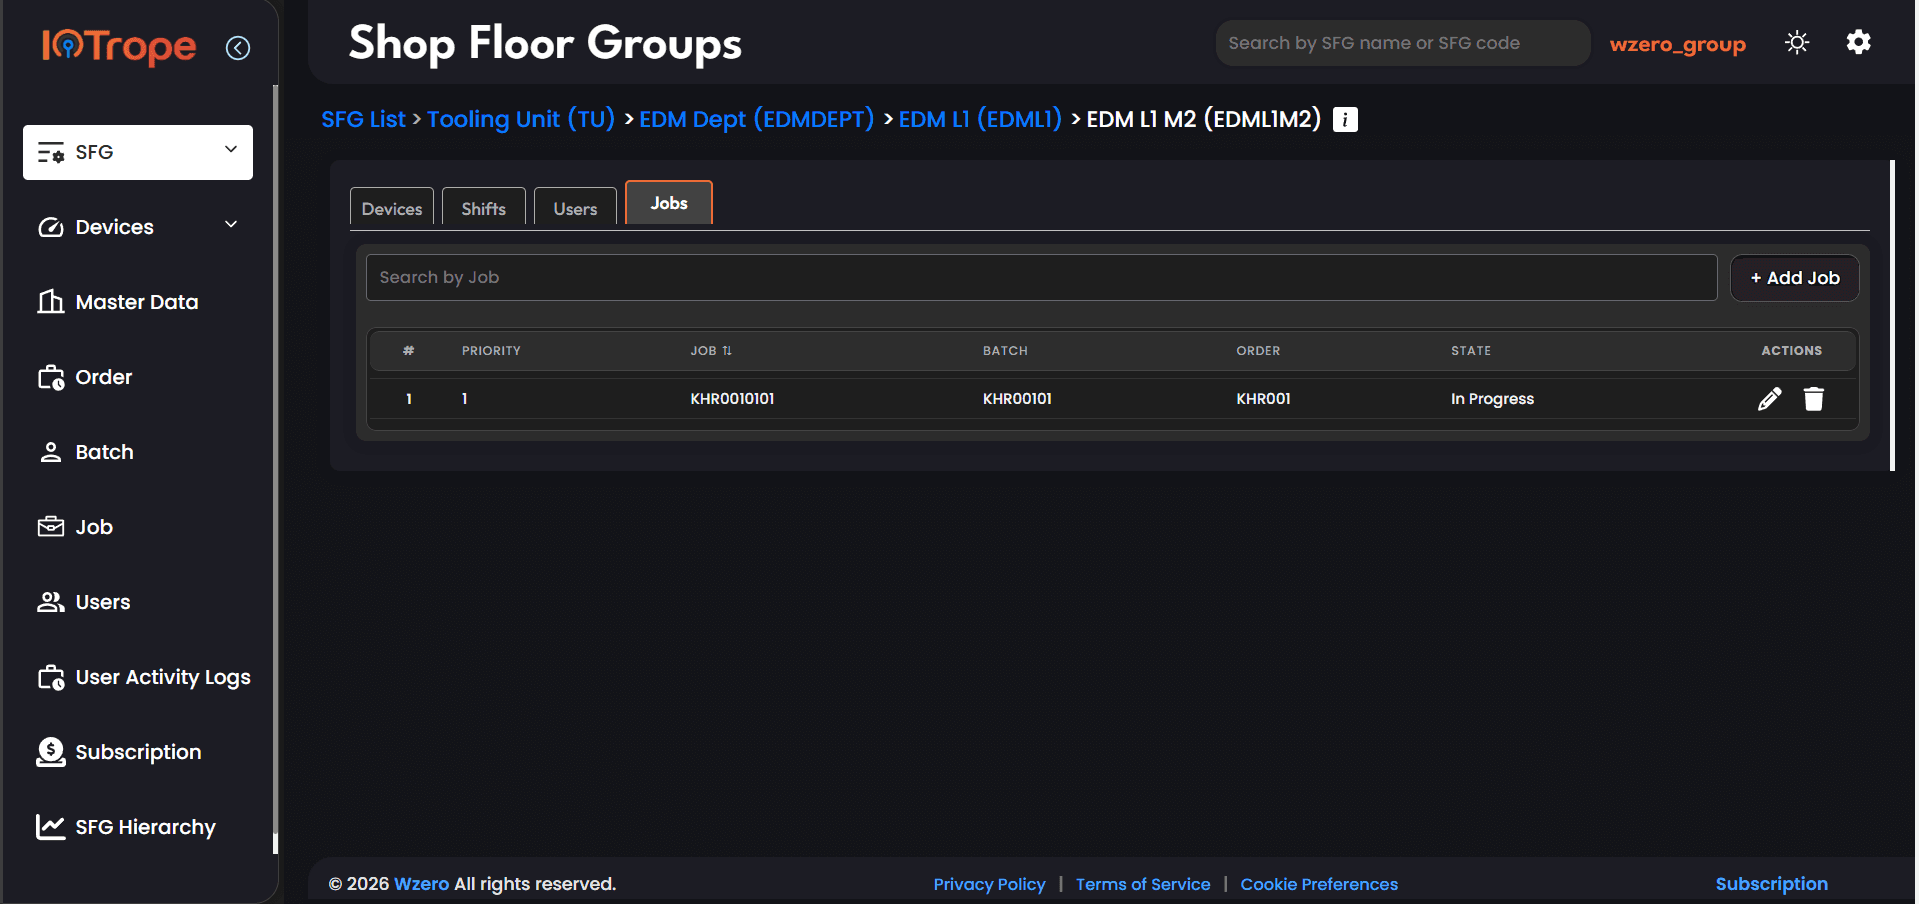
The Jobs tab inside an SFG lists every production job currently assigned to that machine group. Each row shows the priority number, the job code (KHR0010101), the batch it belongs to (KHR00101), the order it traces back to (KHR001), and the job state (In Progress). Jobs can be added via '+ Add Job', searched by name, and edited or deleted. The job listed here is currently active — it is the same job shown in the 'Current Job' field on the live device panel.

  • Job assignment: adding a job to a specific SFG
  • Priority field: how priority 1 becomes the active Current Job
  • Job state: In Progress vs Completed and what transitions them
  • Traceability: Order → Batch → Job → SFG → Device
  • How Current Job on the live device panel is resolved
  • Editing and removing job assignments from an SFG
Job (global)BatchOrderSFG Devices tab (Current Job)SFG Hierarchy Canvas

For: Production planners, job schedulers, and shift supervisors managing work order execution across shopfloor machine groups.

SFG Jobs tab showing job KHR0010101 assigned to EDM L1 M2 with priority 1, batch KHR00101, order KHR001, and In Progress stateSFG Jobs tab showing job KHR0010101 assigned to EDM L1 M2 with priority 1, batch KHR00101, order KHR001, and In Progress state
Click to expand
Device Management

Device Types: CNC Device, Node, and Energy Meter Explained

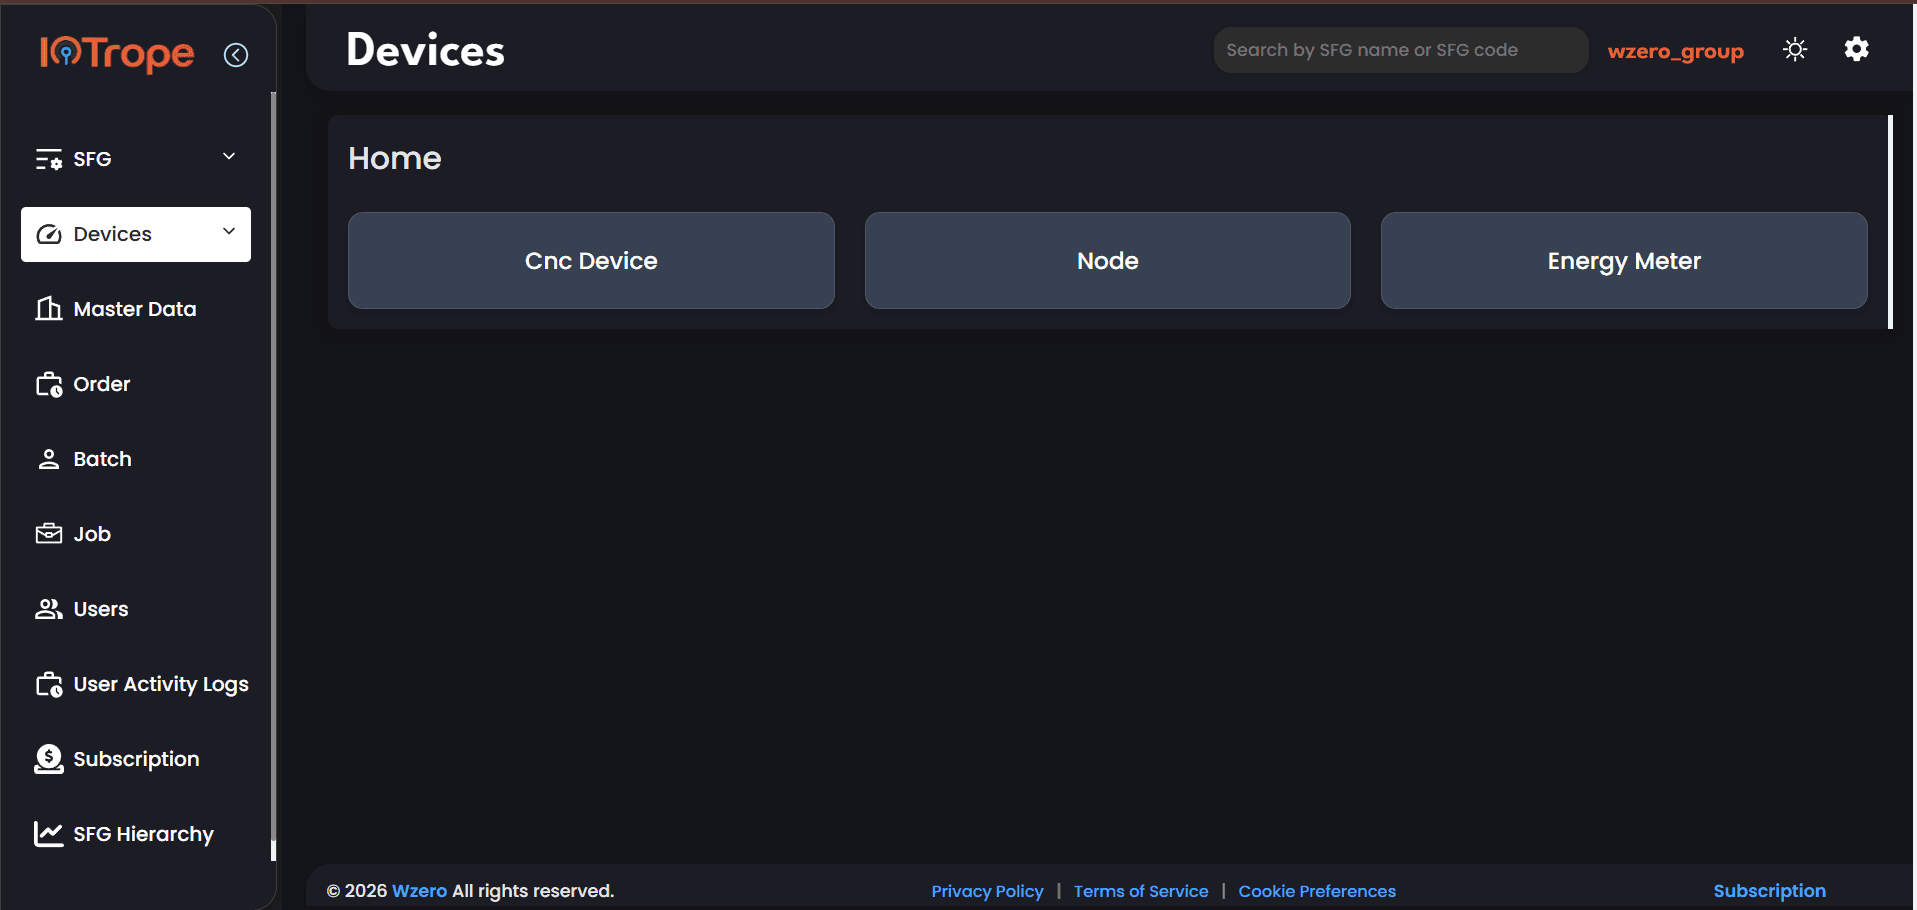
The Devices home screen presents three tiles — CNC Device, Node, and Energy Meter. This is the starting point for all hardware connectivity in IOTrope. CNC Device connects directly to CNC machines and streams machine state data (RUN, PREP, STOP, OFFLINE). Node is a generic IoT node for sensors or machines that communicate via MQTT or SparkplugB. Energy Meter connects to power measurement hardware to stream kWh, voltage, current, and power factor. Each tile leads to a list of registered devices of that type.

  • CNC Device: direct machine connectivity for state streaming (RUN/STOP/OFFLINE)
  • Node: generic IoT node for MQTT/SparkplugB-capable machines and sensors
  • Energy Meter: utility measurement for kWh, voltage, current, power factor
  • Registering a device: name, machine name, model, description
  • Assigning a device to an SFG and what happens in the live panel
  • Device status: OFFLINE vs active and how it is determined
SFG — Devices tabSFG — Live Data timelineMaster Data (indirectly via device data)

For: OT engineers, systems integrators, and plant IT teams responsible for hardware connectivity and device onboarding.

Devices home screen showing three device type tiles: CNC Device, Node, and Energy MeterDevices home screen showing three device type tiles: CNC Device, Node, and Energy Meter
Click to expand
Master Data

Master Data: Shifts — Creating the Global Shift Library

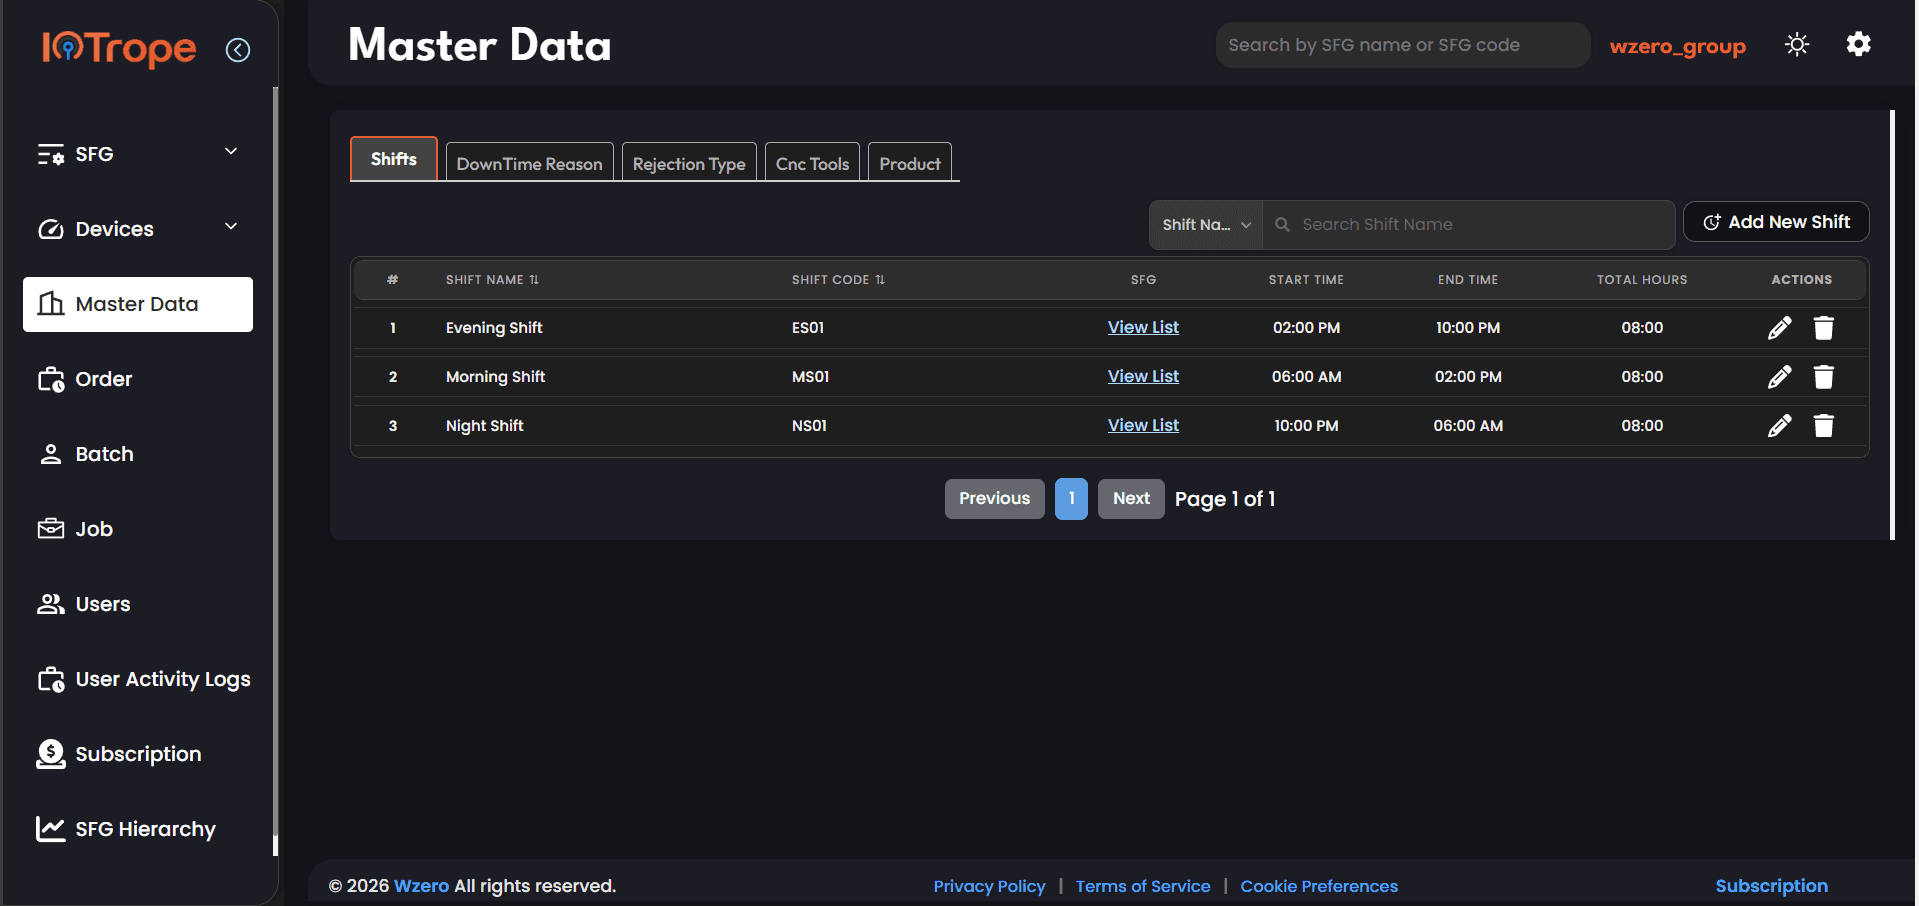
The Master Data Shifts tab is the global library of all shifts defined in the system. Each row shows the shift name, a unique shift code (ES01, MS01, NS01), a 'View List' link showing which SFGs use this shift, the start and end times, and total hours. This is where shifts are created centrally — from here they can be added to any SFG's Shifts tab. The view is paginated and searchable by shift name.

  • Two-tier shift model: global Master Data library vs SFG-level assignment
  • Creating a shift: name, code, start time, end time
  • Shift codes (ES01, MS01, NS01) and why consistent naming matters
  • SFG 'View List': which machine groups are using each shift
  • Total hours calculation and its role in availability reporting
  • Editing and deleting shifts and the downstream effect on SFGs
SFG — Shifts tabSFG — Devices (Current Shift)UsersJobs

For: Production planners and operations managers establishing the shift schedule baseline for their factory.

Master Data Shifts tab showing Evening Shift, Morning Shift, and Night Shift with codes, times, SFG View List links, and total hoursMaster Data Shifts tab showing Evening Shift, Morning Shift, and Night Shift with codes, times, SFG View List links, and total hours
Click to expand
Master Data

Master Data: Downtime Reasons — Categorizing Machine Stoppages

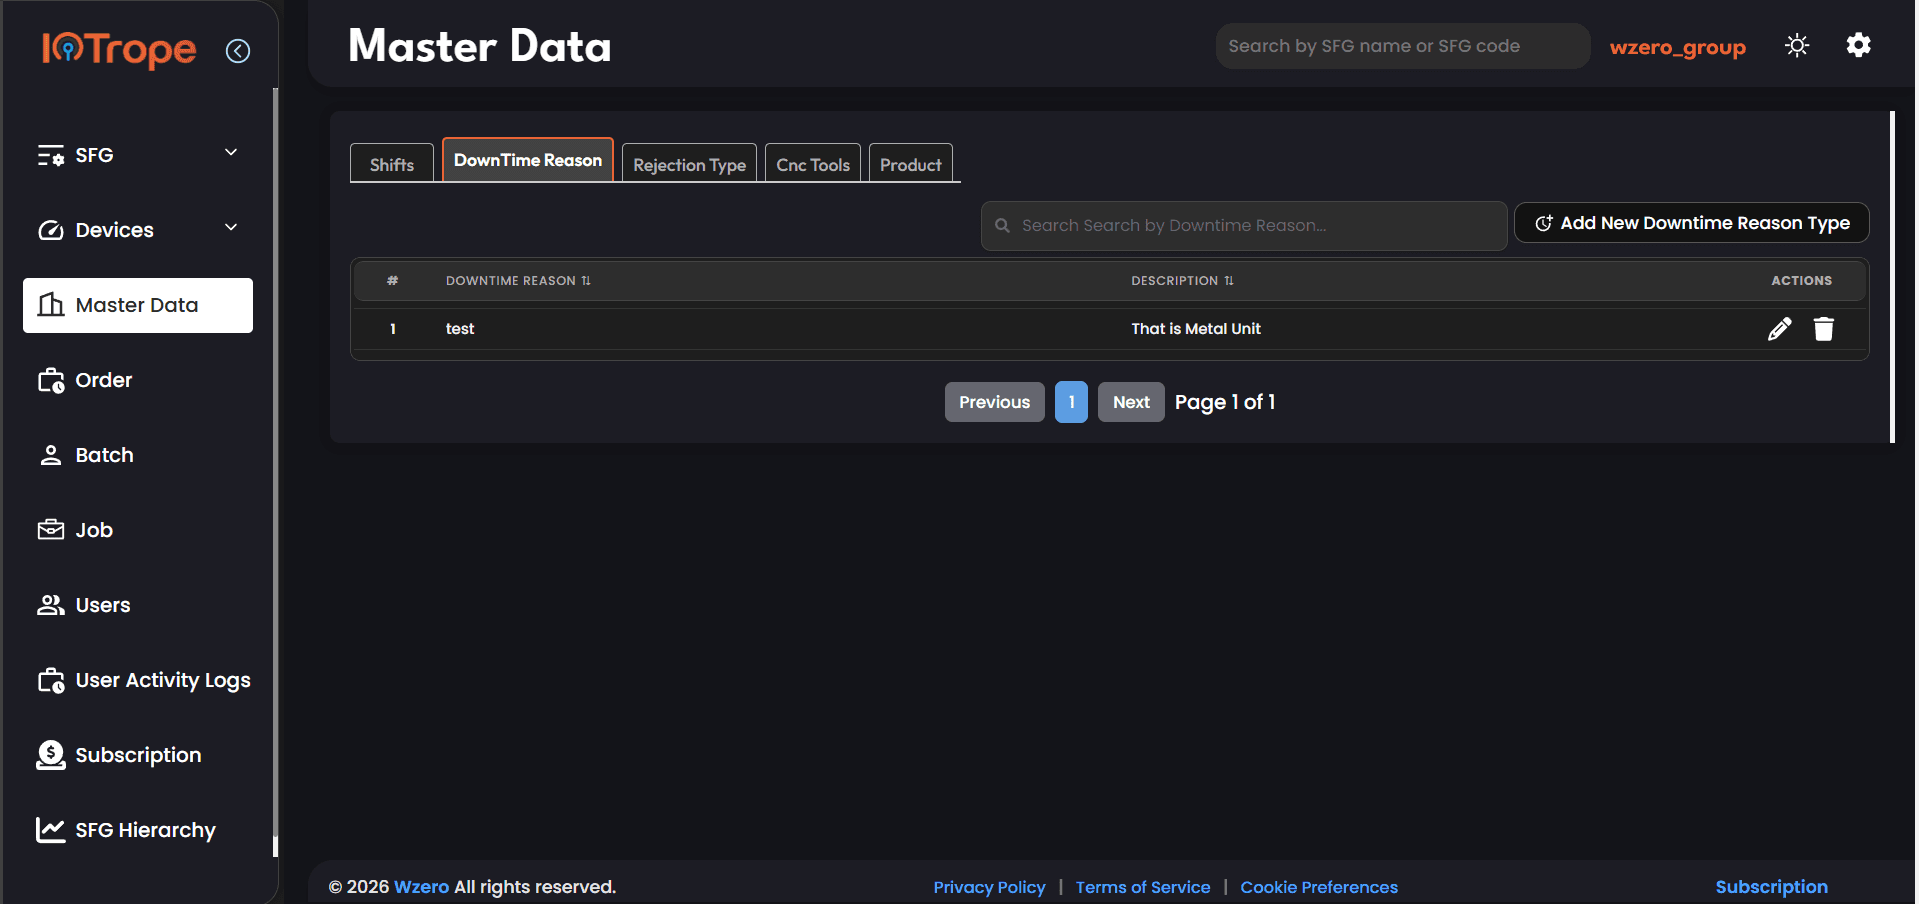
The DownTime Reason tab in Master Data is the global library of all stoppage categories available to operators when they click 'Add DownTime Reason Data' on a live device. Each entry has a reason name and a description. When a machine transitions to STOP or OFFLINE, the operator selects from this list to explain why. The reason is then attached to the downtime event record and used in downtime analysis charts and reports.

  • What a downtime reason is and why structured categorization matters
  • Creating downtime reason entries: name and description
  • How operators select a reason via 'Add DownTime Reason Data' on the live device
  • Downtime event record: machine, reason, start time, end time, duration
  • How downtime reasons feed into OEE Availability calculations
  • Building a useful reason taxonomy: planned vs unplanned, mechanical vs human
SFG — Devices tab (Add DownTime Reason Data)Master Data — Rejection TypeOEE reporting

For: Production engineers and operations managers building the downtime taxonomy that enables meaningful root-cause analysis.

Master Data DownTime Reason tab showing a downtime reason entry named 'test' with description 'That is Metal Unit'Master Data DownTime Reason tab showing a downtime reason entry named 'test' with description 'That is Metal Unit'
Click to expand
Master Data

Master Data: Rejection Types — Classifying Quality Issues at the Machine

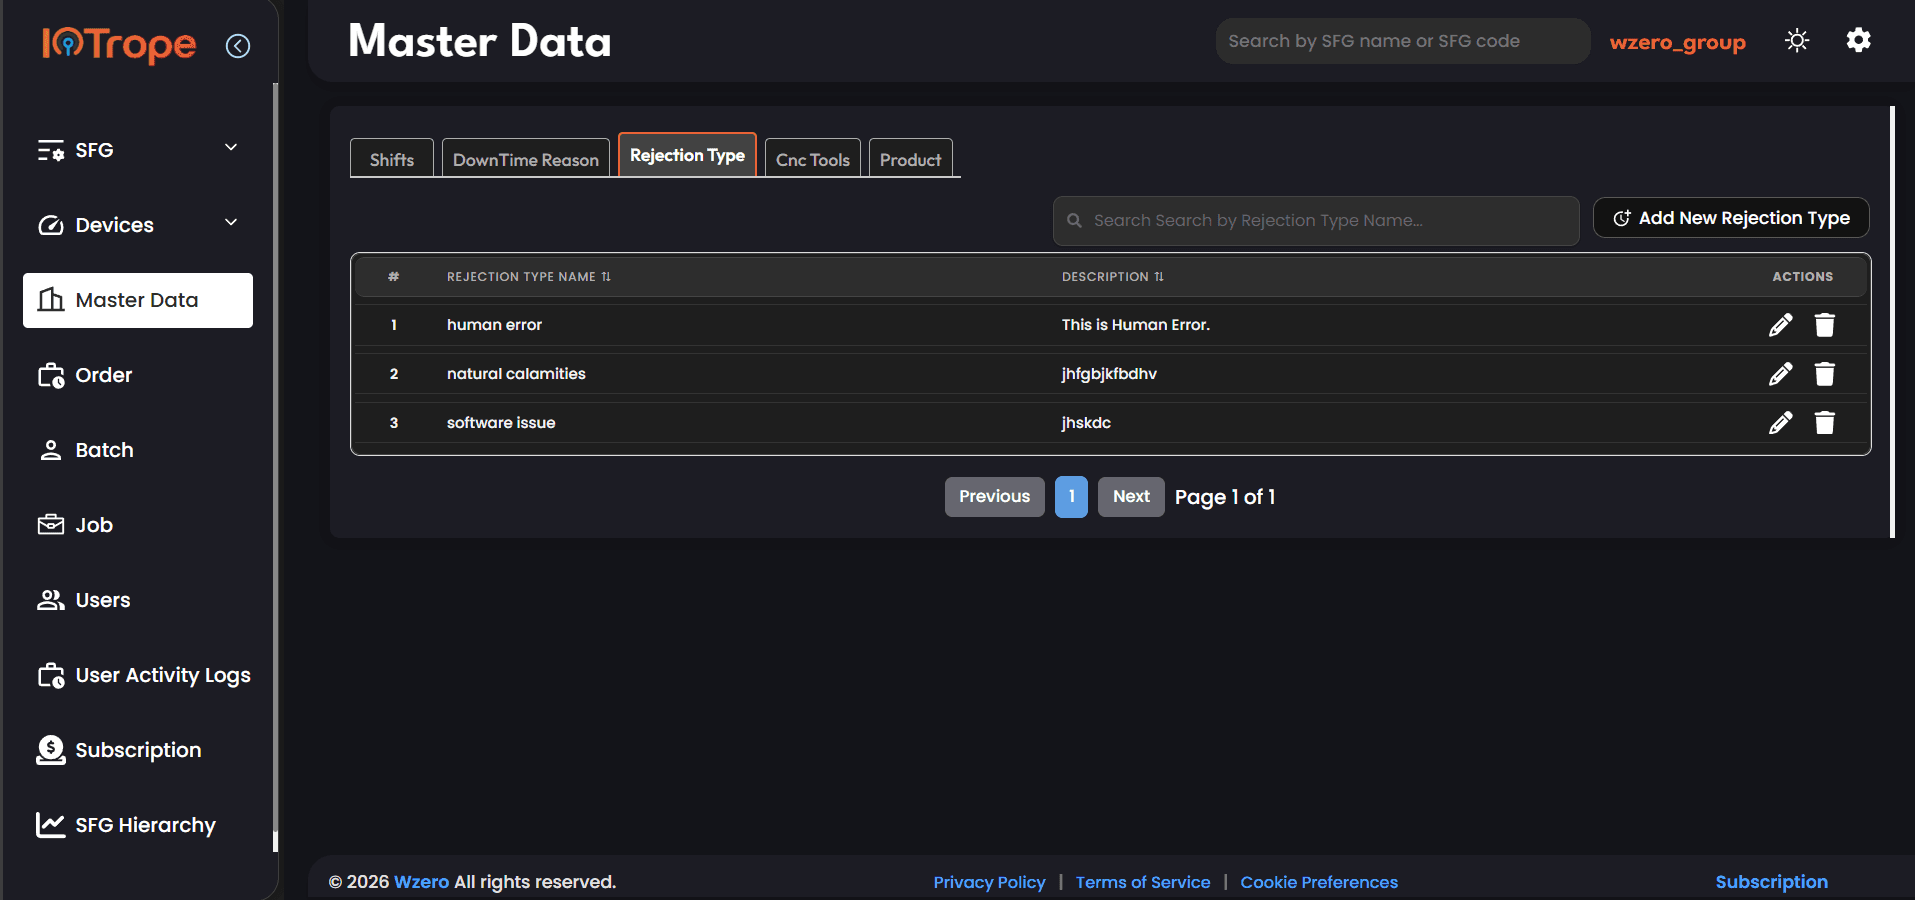
The Rejection Type tab in Master Data lists all quality failure categories available to operators. Here you see three: 'human error' (This is Human Error.), 'natural calamities', and 'software issue'. When an operator clicks 'Add Rejection Data' on a live device, they pick from this list and enter the quantity of rejected parts. The rejection type and count are attached to the production record and used in the Quality component of OEE.

  • Defining rejection types: name and description in Master Data
  • Three example types: human error, natural calamities, software issue
  • How operators log rejection data via 'Add Rejection Data' on the live device
  • OEE Quality formula: good parts = total produced minus rejected
  • Designing a useful rejection taxonomy for manufacturing environments
  • Rejection data in quality trend reports and shift-level analysis
SFG — Devices tab (Add Rejection Data)Master Data — DownTime ReasonOEE Quality metric

For: Quality engineers and production managers establishing the quality classification system for shopfloor data collection.

Master Data Rejection Type tab showing three entries: human error, natural calamities, and software issue with descriptionsMaster Data Rejection Type tab showing three entries: human error, natural calamities, and software issue with descriptions
Click to expand
Master Data

Master Data: CNC Tools — Registering Tooling for Job Setup

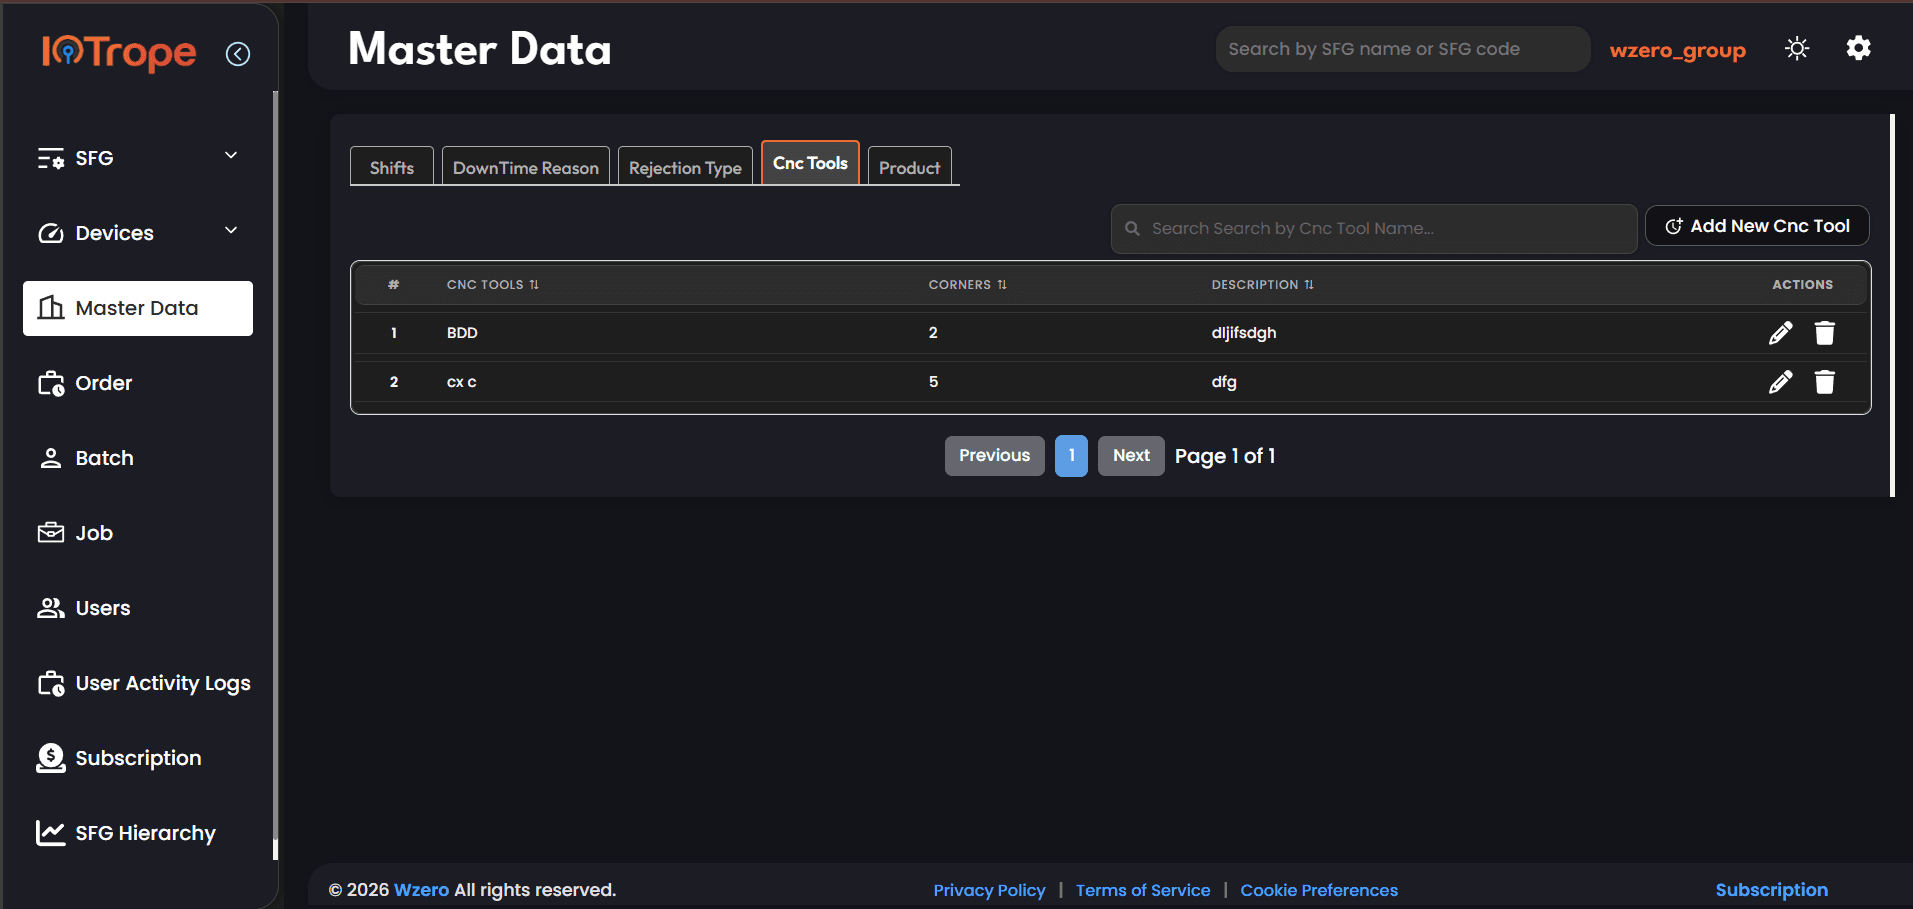
The CNC Tools tab in Master Data lists all registered cutting tools available in the factory. Each tool has a name (BDD, cx c), a corners count (2 and 5 respectively — indicating the number of cutting edges), and a description. These tools are referenced when setting up jobs (Job Setup field in the Job module). Knowing which tool is used on which job links tooling wear, machine performance, and production output together.

  • Registering a CNC tool: name, corners (cutting edges), description
  • What 'corners' means: number of usable cutting edges on the tool insert
  • How tools are referenced in Job Setup (CNU-1 format in Job module)
  • Tool-job traceability: linking a tool to a batch and order
  • Using tool data to correlate cycle time and surface quality outcomes
  • Managing the tool library as equipment changes over time
Job (Job Setup field)BatchMaster Data — Shifts, DownTime Reason, Rejection Type, Product

For: CNC programmers, tooling engineers, and production supervisors managing tooling inventory and job setup configuration.

Master Data CNC Tools tab showing two tools: BDD with 2 corners and cx c with 5 corners, each with a descriptionMaster Data CNC Tools tab showing two tools: BDD with 2 corners and cx c with 5 corners, each with a description
Click to expand
Master Data

Master Data: Products — The Foundation of Orders, Batches, and Jobs

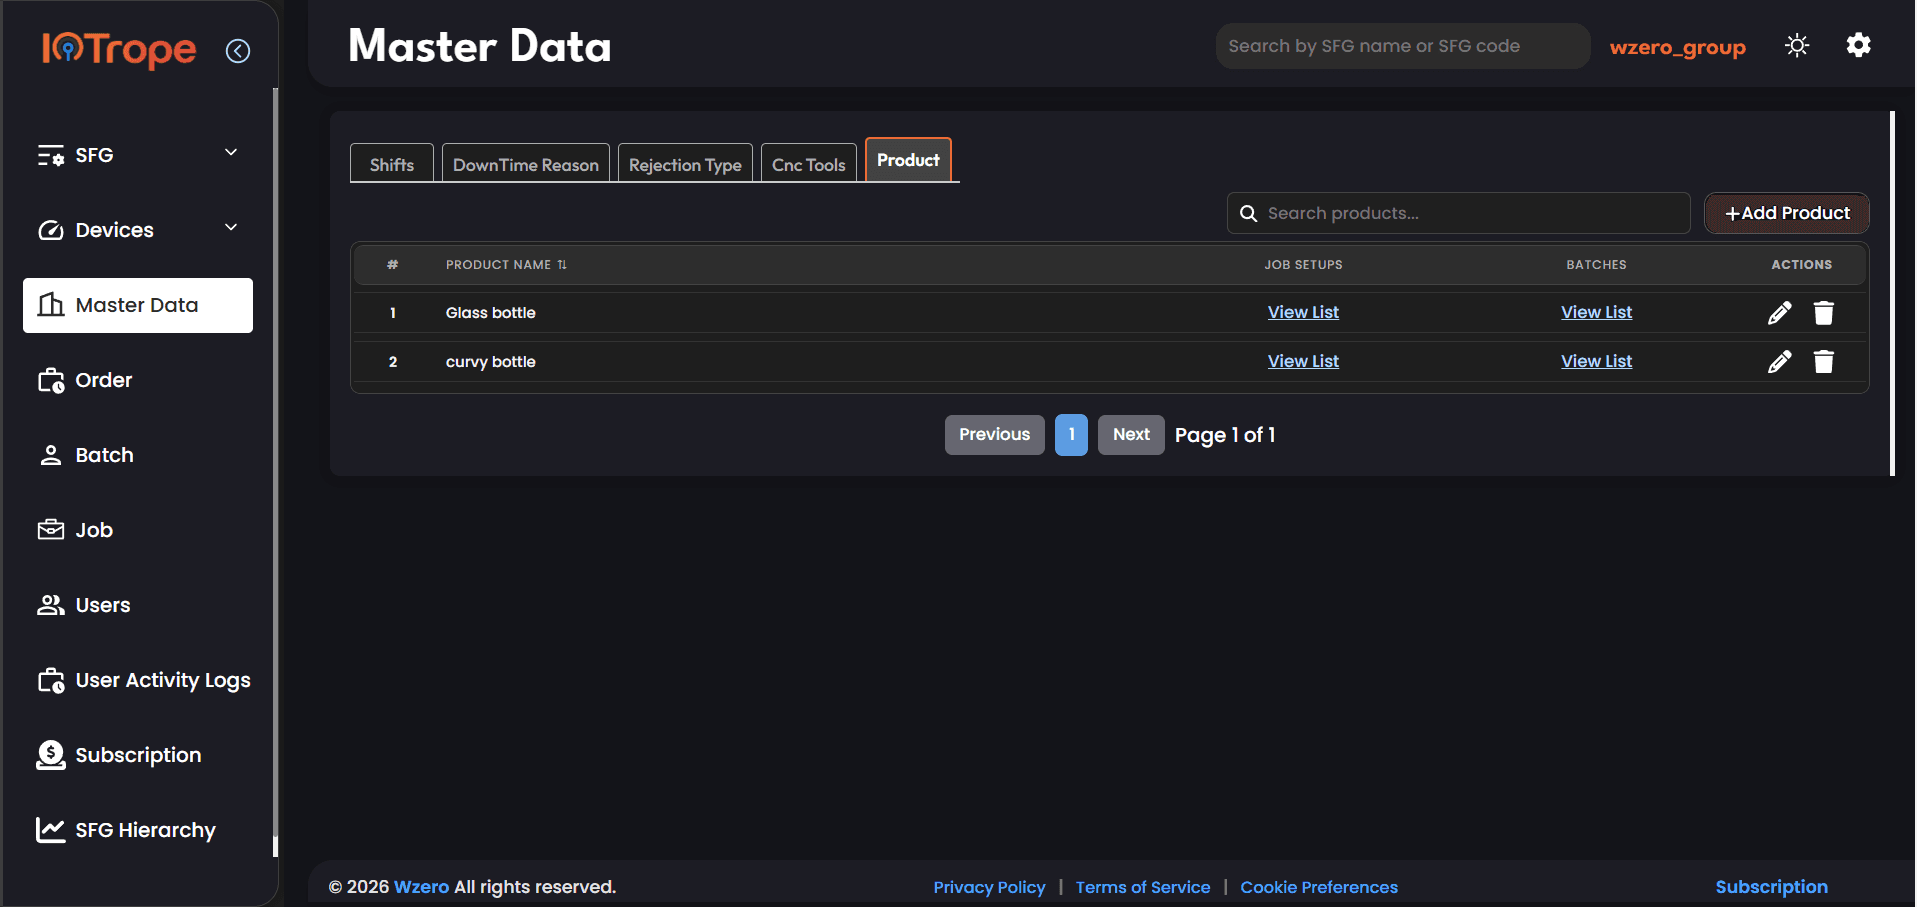
The Product tab in Master Data lists all products manufactured in the factory. Each product (Glass bottle, curvy bottle) has two 'View List' columns — one for Job Setups (the machining configurations for this product) and one for Batches (all batches that have been produced for this product). Products are the root reference entity: an Order is placed for a product, a Batch is created to fulfill that order quantity, and Jobs are the individual work steps to produce the batch.

  • Creating a product: name as the primary identifier
  • Job Setups: machining configurations (tool, parameters) defined per product
  • Batches: production runs created to fulfill orders for this product
  • How the product name appears on the live device as 'Current Product'
  • Product-order-batch-job traceability chain
  • Managing product variants and multiple job setups per product
Order ManagementBatchJobSFG — Devices tab (Product field)

For: Production engineers, product managers, and operations leads setting up the product catalog that drives order and batch management.

Master Data Product tab showing Glass bottle and curvy bottle with View List links for Job Setups and BatchesMaster Data Product tab showing Glass bottle and curvy bottle with View List links for Job Setups and Batches
Click to expand
Order Management

Batch Management: Grouping Production Quantities for Traceability

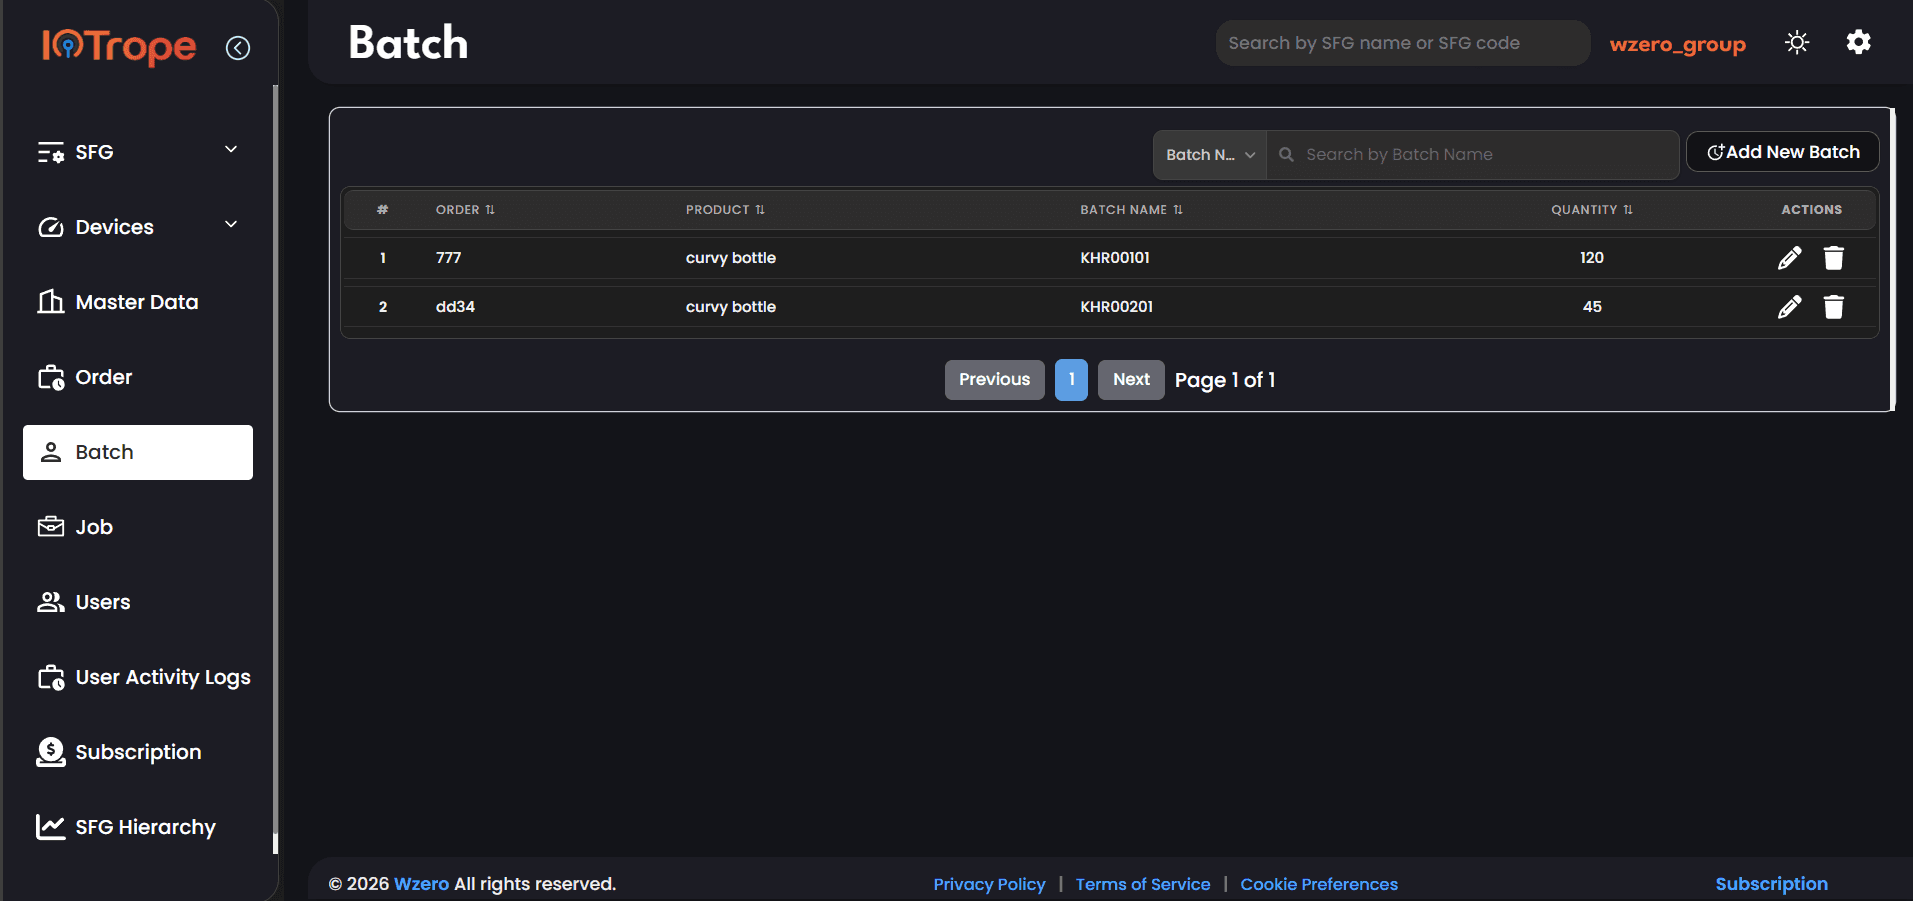
The Batch page lists all production batches across all orders. Each row shows the order it belongs to (777, dd34), the product being produced (curvy bottle for both), the batch name (KHR00101, KHR00201), and the quantity (120, 45). Batches are the production unit between an order and a job — one order can have multiple batches, and each batch spawns one or more jobs for shopfloor execution. The batch name appears in the Current Batch field on the live device panel.

  • What a batch is: the quantity unit between an order and a job
  • Creating a batch: selecting order, product, batch name, quantity
  • One order → multiple batches: managing partial runs and re-runs
  • Batch → Job: how jobs are created to execute a batch quantity
  • Batch code (KHR00101) traceability: from machine to delivery
  • Batch quantity and how it relates to job quantity and production count
Order ManagementJobSFG — Jobs tabSFG — Devices (Current Batch)Master Data — Product

For: Production controllers and operations planners managing batch-level production scheduling and traceability.

Batch list showing two batches: KHR00101 for order 777 and curvy bottle with quantity 120, and KHR00201 for order dd34 with quantity 45Batch list showing two batches: KHR00101 for order 777 and curvy bottle with quantity 120, and KHR00201 for order dd34 with quantity 45
Click to expand
Order Management

Job Management: Scheduling and Tracking Production Jobs

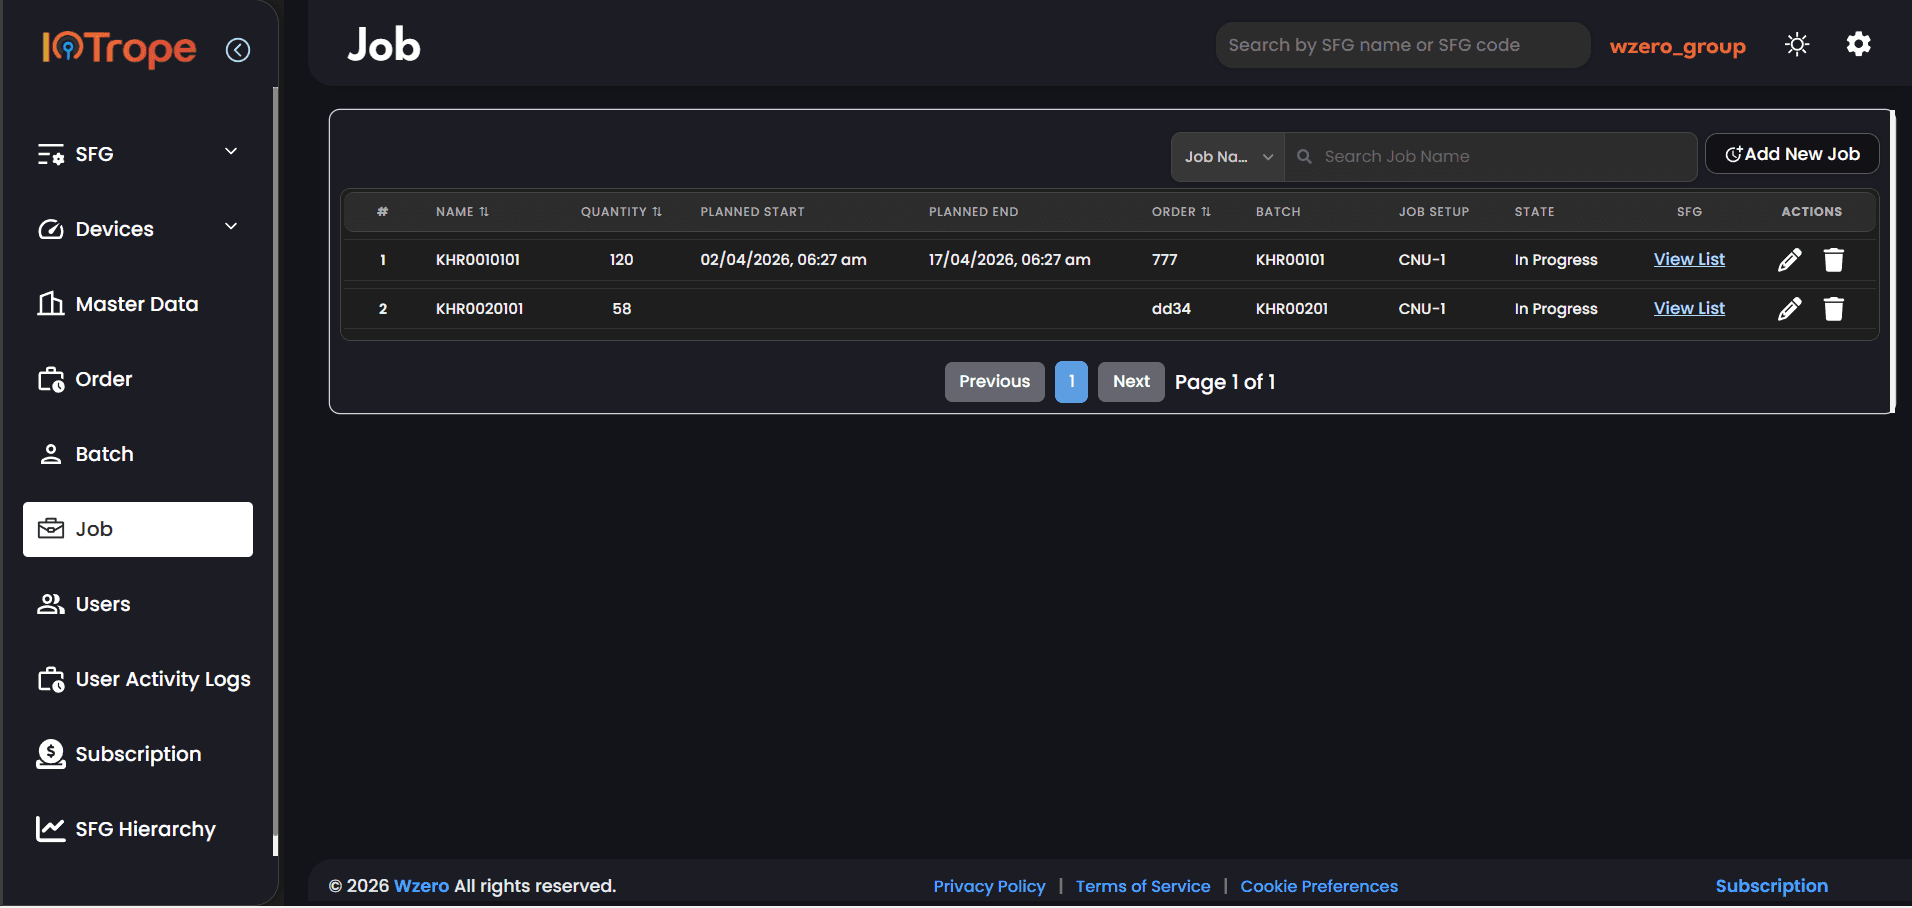
The Job page lists all production jobs across all orders and batches. Each row shows the job name, quantity, planned start and end dates, the order and batch it belongs to, the Job Setup used (CNU-1 for both), the current state (In Progress), and a View List link showing which SFGs this job has been assigned to. Job KHR0010101 runs from 02/04/2026 to 17/04/2026 for 120 units. Job KHR0020101 has no planned dates yet and 58 units outstanding.

  • Creating a job: name, quantity, planned start, planned end
  • Linking a job to an order, batch, and job setup
  • Job Setup (CNU-1): the machining configuration from the product's setup list
  • Assigning a job to one or more SFGs via the Jobs tab
  • Job state: In Progress vs Completed and what triggers the transition
  • SFG View List: which machine groups are executing this job
  • How Current Job on the live device panel is resolved from active job assignments
BatchOrder ManagementSFG — Jobs tabMaster Data — CNC Tools (via Job Setup)SFG — Devices (Current Job)

For: Production schedulers, shop floor supervisors, and planning teams managing job-level execution across machine groups.

Job list showing two jobs: KHR0010101 with quantity 120 planned 02/04 to 17/04 for order 777, batch KHR00101, job setup CNU-1, In Progress, with SFG View List; and KHR0020101 quantity 58 for order dd34Job list showing two jobs: KHR0010101 with quantity 120 planned 02/04 to 17/04 for order 777, batch KHR00101, job setup CNU-1, In Progress, with SFG View List; and KHR0020101 quantity 58 for order dd34
Click to expand
User & Access Control

User Management: Roles, Access, and Multi-SFG Assignment

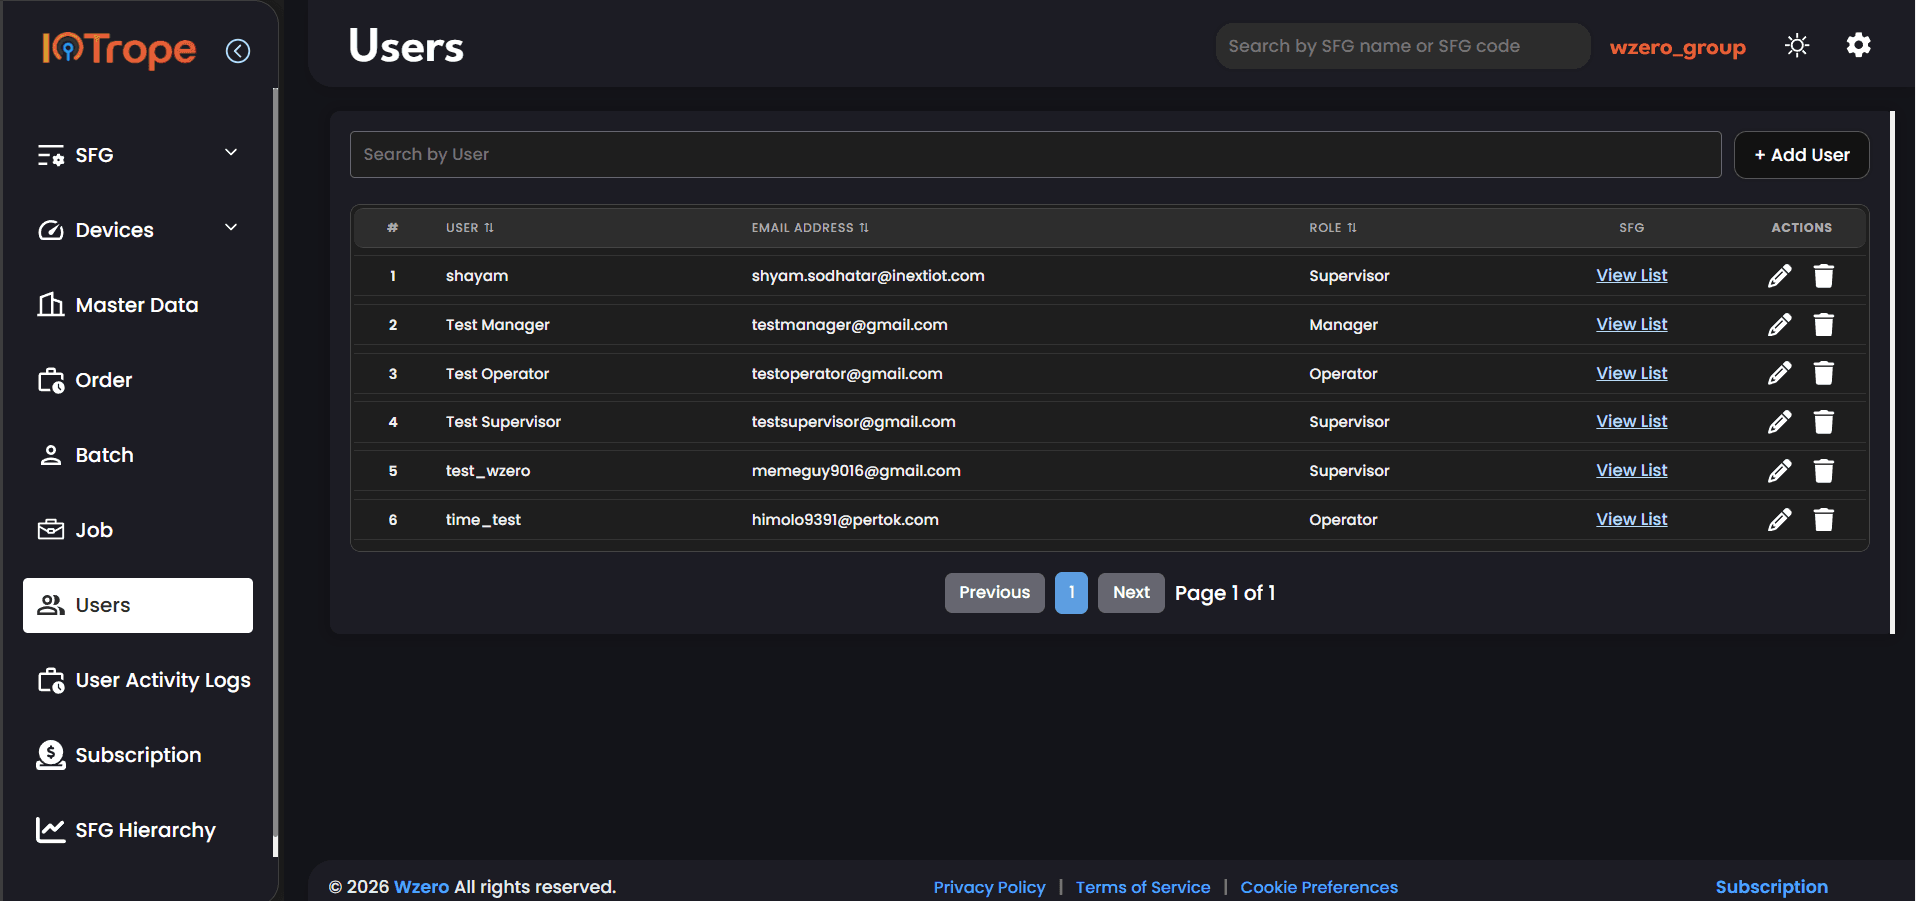
The Users page is the global roster of all platform users. Each row shows the user name, email address, role (Supervisor, Manager, or Operator), and a 'View List' link to see which SFGs this user has been assigned to. Six users are shown: shayam (Supervisor), Test Manager (Manager), Test Operator (Operator), Test Supervisor (Supervisor), test_wzero (Supervisor), and time_test (Operator). Users are created here and then added to specific SFGs via the SFG → Users tab.

  • Three roles: Operator (data entry), Manager (reporting), Supervisor (full access)
  • Creating a user: name, email address, role
  • SFG assignment: adding a global user to a specific machine group
  • How a user's SFG assignment determines their shopfloor access scope
  • View List: seeing which SFGs each user is assigned to
  • Users as live context: how Current User is resolved from SFG user assignments
SFG — Users tabSFG — Shifts tab (shift-user assignment)SFG — Devices (Current Users)User Activity Logs

For: IT administrators and operations managers setting up and maintaining the user roster for shopfloor platform access.

Users page listing 6 users with email, role (Supervisor, Manager, Operator), and SFG View List linksUsers page listing 6 users with email, role (Supervisor, Manager, Operator), and SFG View List links
Click to expand
User & Access Control

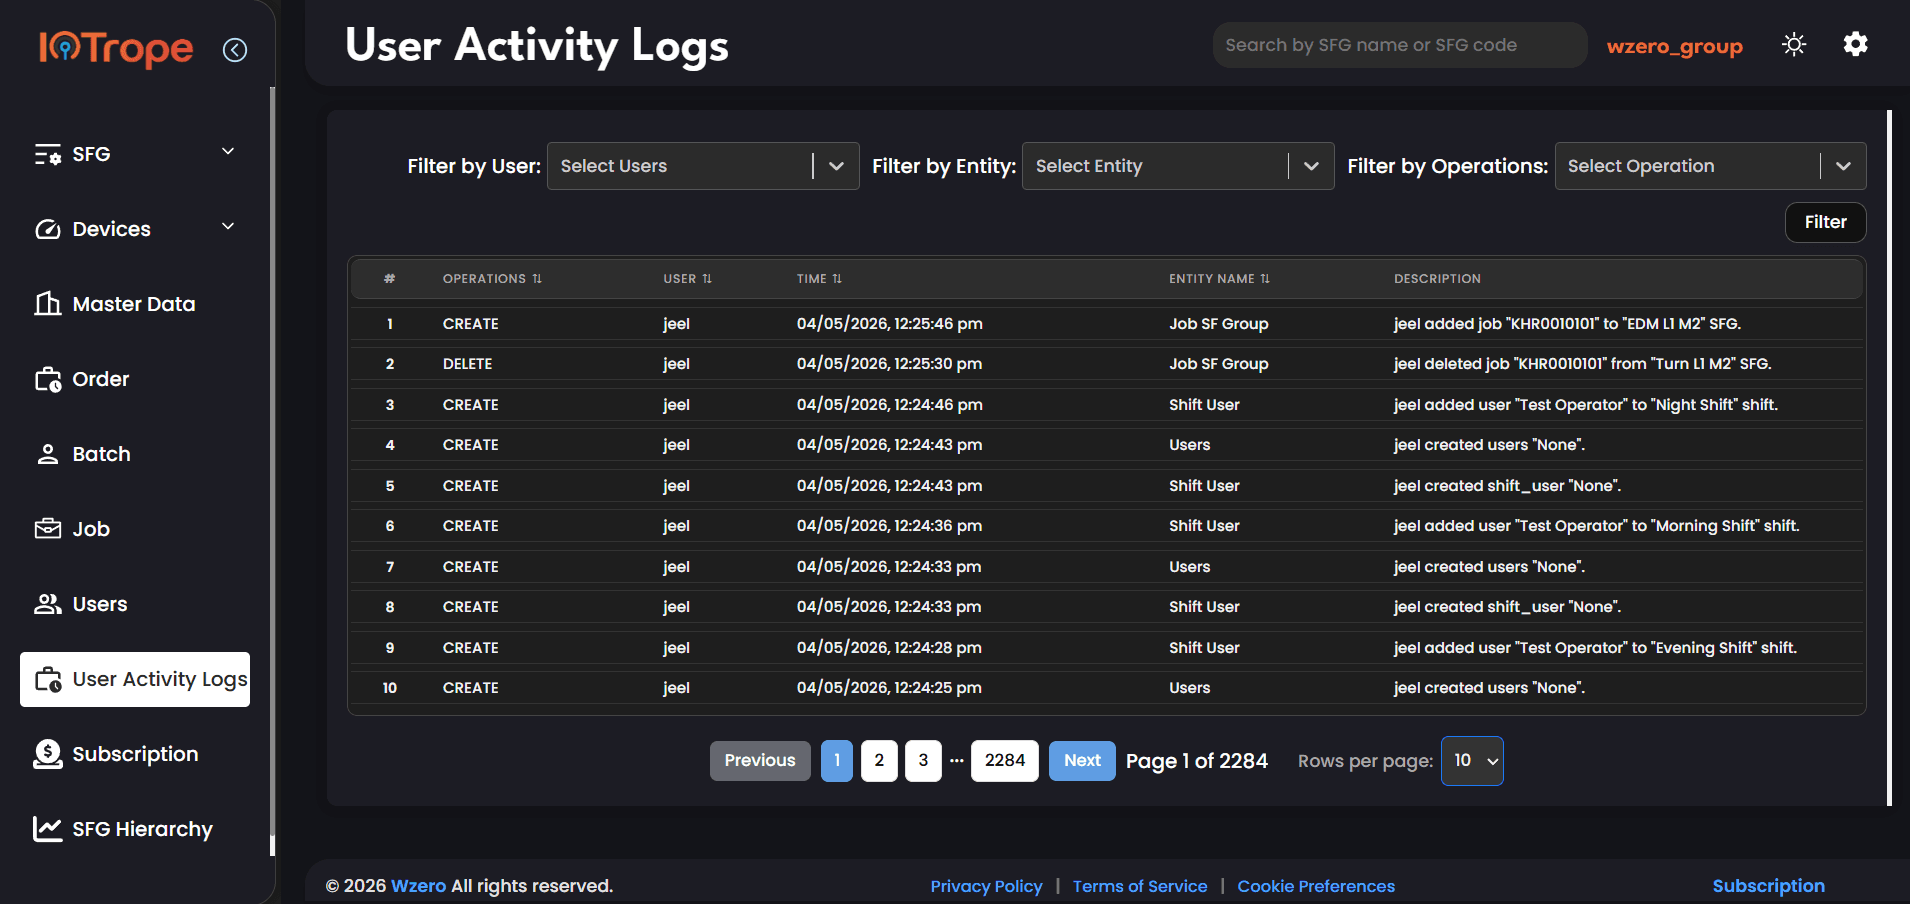
User Activity Logs: Full Audit Trail Across All Platform Operations

The User Activity Logs page records every action taken in the system. The table shows 10 entries per page (2,284 pages = ~22,840 total log entries in this instance). Each row has an Operation (CREATE, DELETE), the User who performed it (jeel), the exact Timestamp (04/05/2026, 12:25:46 pm), the Entity Name (Job SF Group, Shift User, Users), and a human-readable Description ('jeel added job KHR0010101 to EDM L1 M2 SFG'). The page has three filter dropdowns: Filter by User, Filter by Entity, Filter by Operations — enabling precise audit queries.

  • What gets logged: CREATE, DELETE, UPDATE across all entities
  • Log record fields: operation, user, timestamp, entity name, description
  • Filter by User: tracing all actions taken by a specific person
  • Filter by Entity: seeing all changes to Jobs, SFGs, Shifts, Users
  • Filter by Operation: isolating creates vs deletes for audit review
  • Scale: 22,000+ log entries — pagination and rows-per-page control
  • Using logs for incident investigation and compliance reporting
UsersSFG — Users tabSFG — Jobs tabSFG — Shifts tabAll modules (every action is logged)

For: Compliance officers, IT security leads, and plant managers requiring an auditable record of all operational changes.

User Activity Logs page showing 10 recent log entries with operation type, user, timestamp, entity name, and description — 2284 pages totalUser Activity Logs page showing 10 recent log entries with operation type, user, timestamp, entity name, and description — 2284 pages total
Click to expand
Shop Floor Management

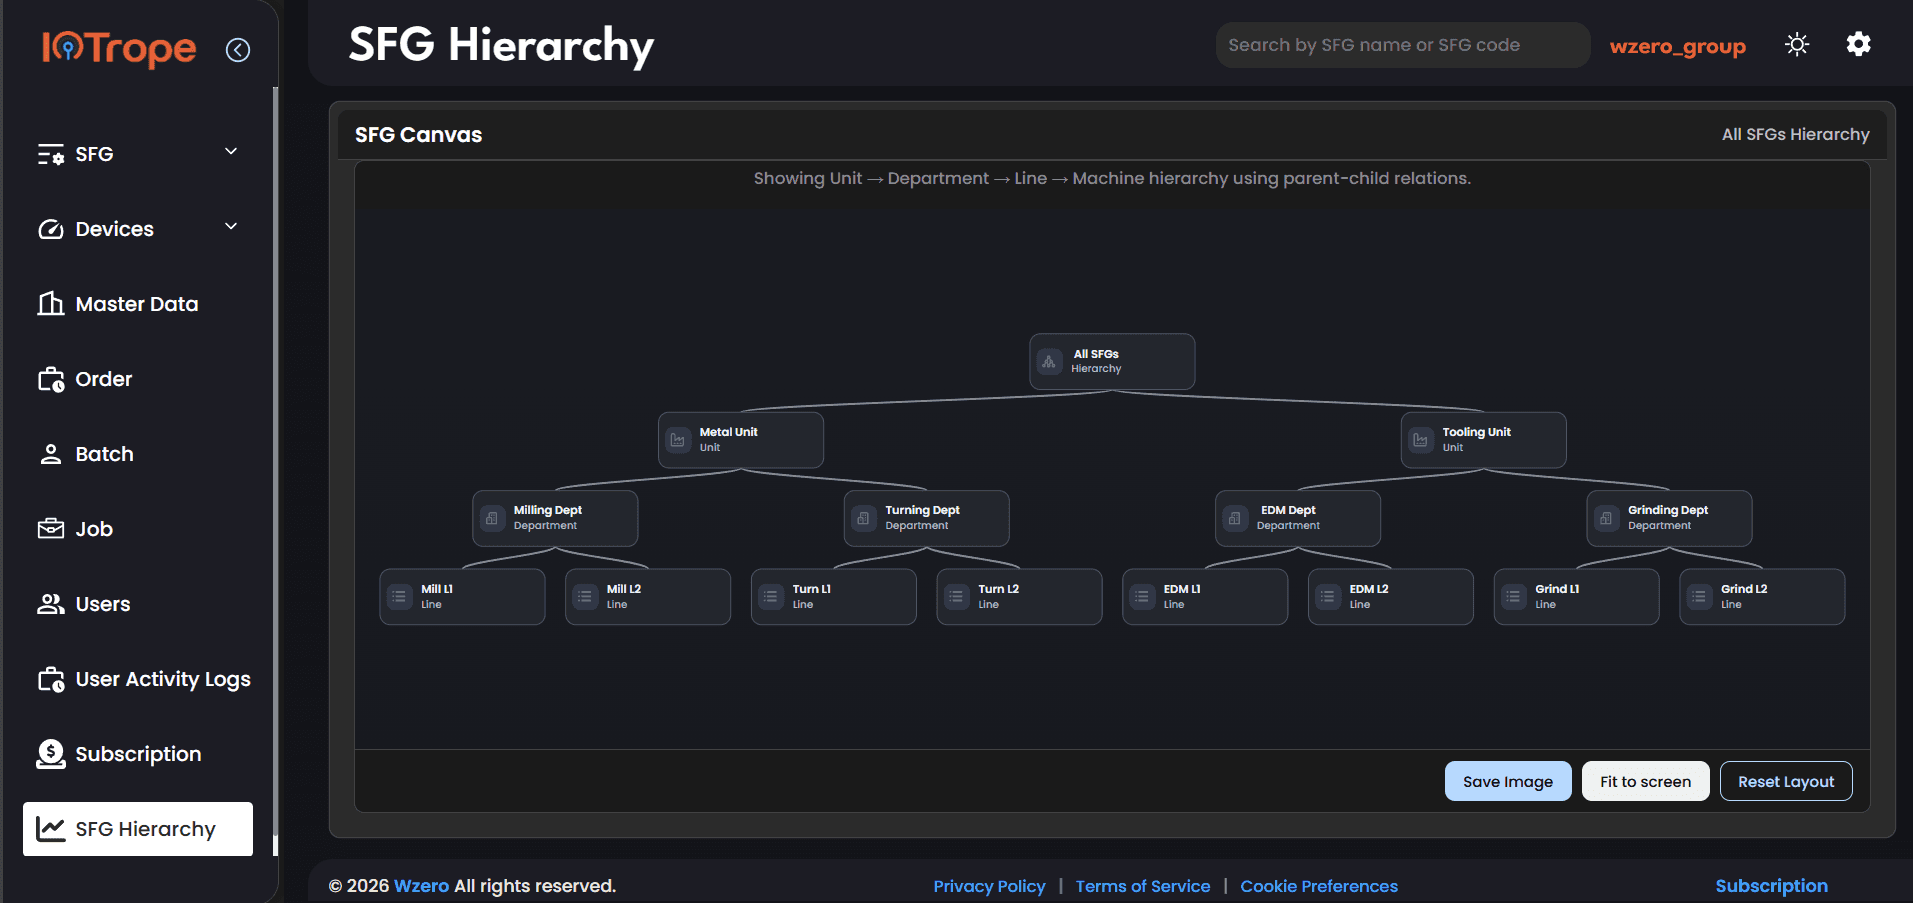
SFG Hierarchy Canvas: Visualizing Your Full Factory Structure

The SFG Hierarchy page shows the complete factory tree as a visual canvas. At the top is 'All SFGs Hierarchy'. Below it are two units: Metal Unit and Tooling Unit. Metal Unit has two departments (Milling Dept and Turning Dept); Tooling Unit has two (EDM Dept and Grinding Dept). Each department expands to show its Lines — Mill L1, Mill L2, Turn L1, Turn L2, EDM L1, EDM L2, Grind L1, Grind L2. The canvas has three actions: Save Image (export as PNG), Fit to Screen, and Reset Layout. Each node is labeled with its name and type (Unit, Department, Line).

  • How the canvas is generated from SFG parent-child relationships
  • Reading the tree: All SFGs → Unit → Department → Line → Machine
  • Node types visible on the canvas: Unit, Department, Line (Machines are one level deeper)
  • Using 'Fit to Screen' and 'Reset Layout' for navigation
  • Exporting the hierarchy as a PNG with 'Save Image'
  • Using the canvas for factory onboarding, audits, and stakeholder reviews
  • What changes in the SFG list automatically update the canvas
SFG — List viewSFG — All tabs (Devices, Shifts, Users, Jobs)All modules (the canvas is a read-only map of the whole system)

For: Plant directors, operations managers, and IT-OT leads who need a visual overview of the factory structure for planning, communication, and governance.

SFG Hierarchy canvas showing the full factory tree: All SFGs at top, Metal Unit and Tooling Unit as children, then Milling/Turning/EDM/Grinding Dept, then Mill L1, Mill L2, Turn L1, Turn L2, EDM L1, EDM L2, Grind L1, Grind L2 as leaf linesSFG Hierarchy canvas showing the full factory tree: All SFGs at top, Metal Unit and Tooling Unit as children, then Milling/Turning/EDM/Grinding Dept, then Mill L1, Mill L2, Turn L1, Turn L2, EDM L1, EDM L2, Grind L1, Grind L2 as leaf lines
Click to expand